It only took a handful of months for the U.S. economy to reel from COVID-19’s effects.
As unemployment rates hit all-time highs and businesses scrambled to stay afloat, new data shows that current dollar GDP plummeted from nearly $21.6 trillion down to $19.5 trillion between Q1’2020 and Q2’2020 (seasonally adjusted at annual rates).
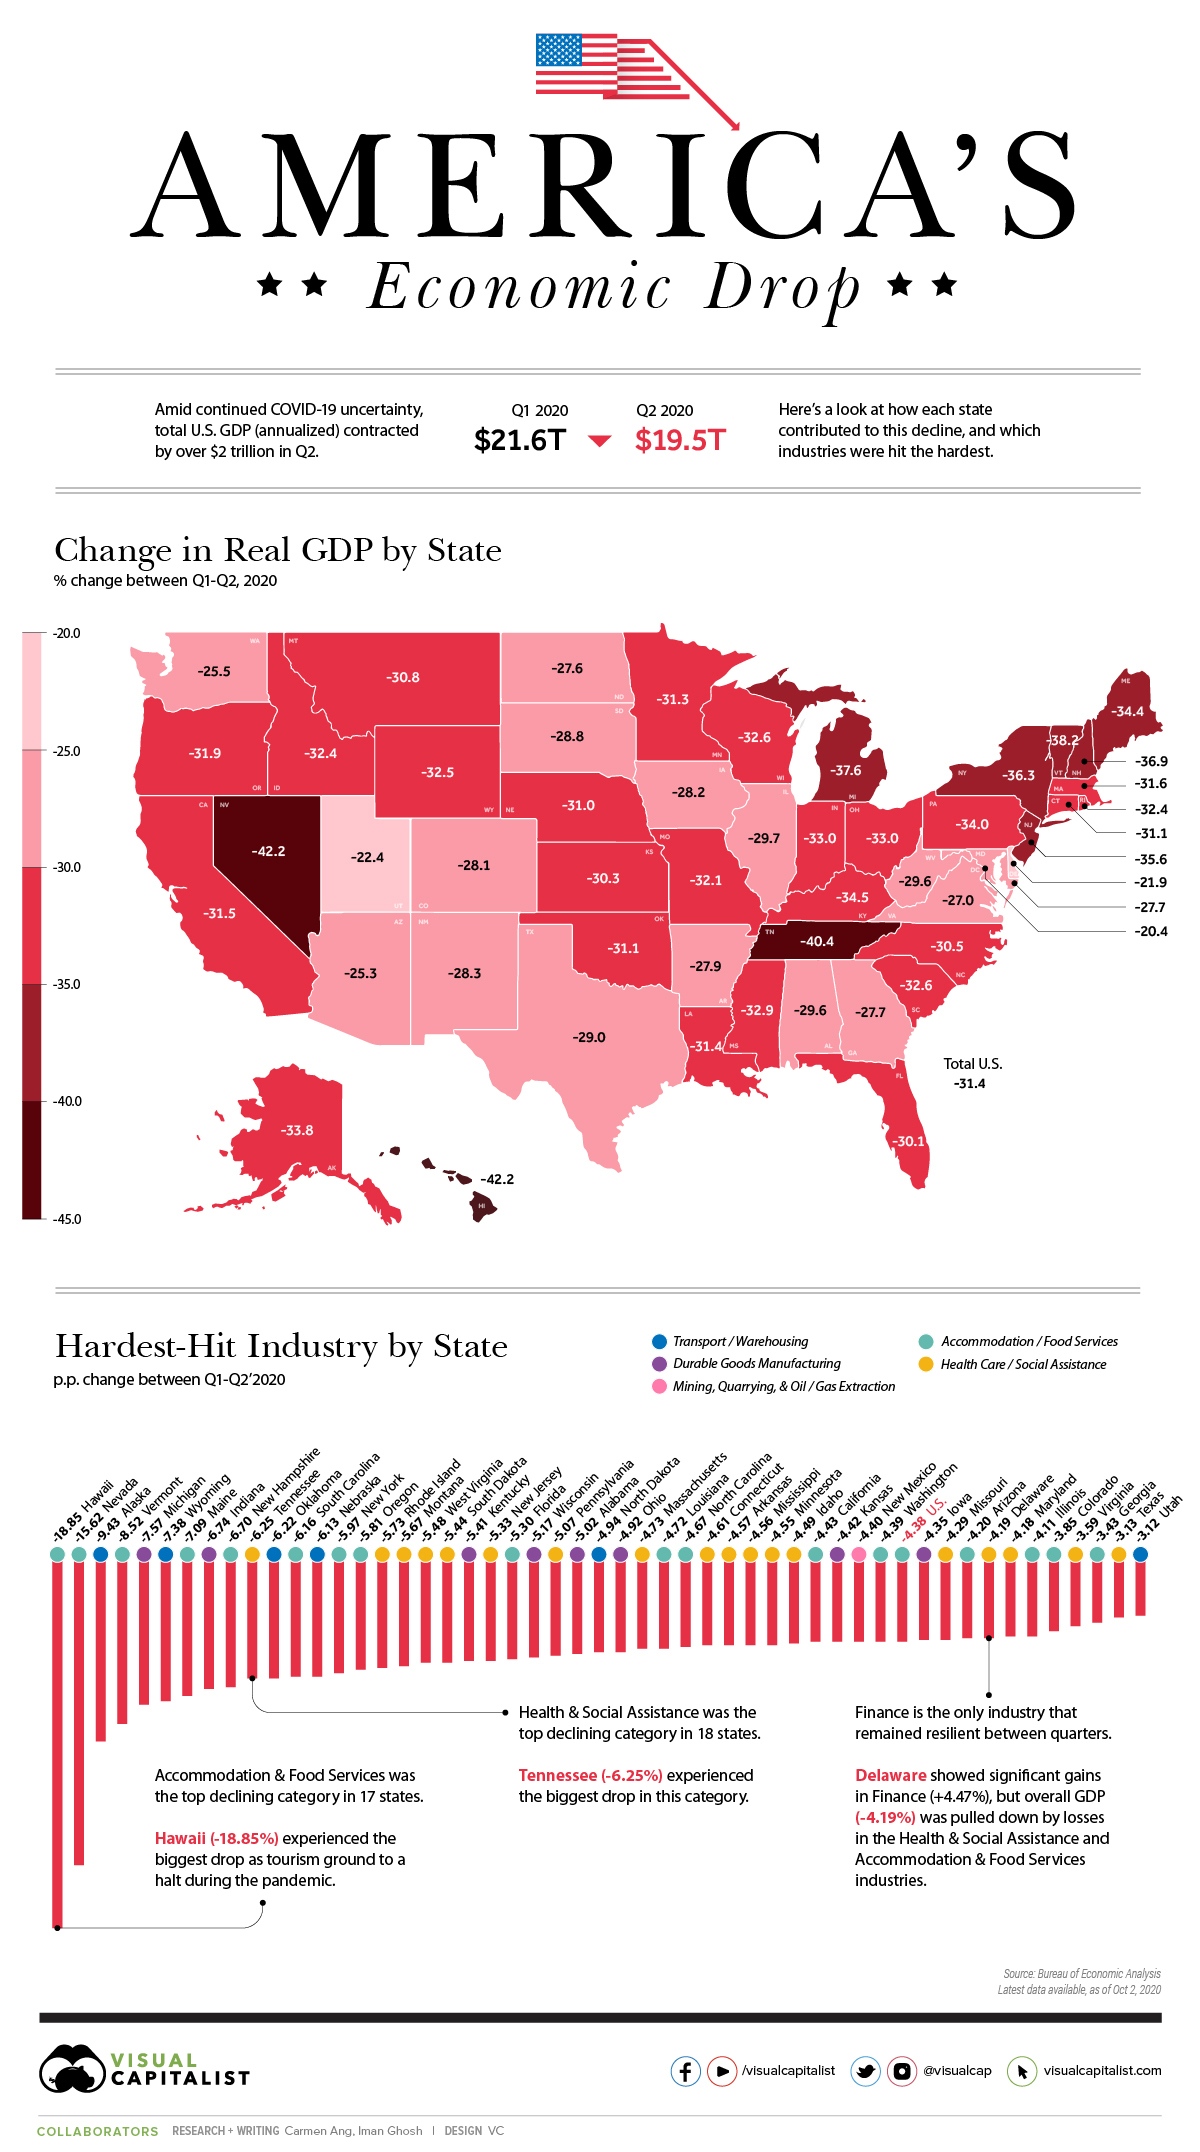
While all states experienced a decline, the effects were not distributed equally across the nation. This visualization takes a look at the latest data from the Bureau of Economic Analysis, uncovering the biggest declines across states, and which industries were most affected by COVID-19 related closures and uncertainty.
Change in GDP by State and Industry
Between March-June 2020, stay-at-home orders resulted in disruptions to consumer activity, health, and the broader economy, causing U.S. GDP to fall by 31.4% from numbers posted in Q1.
The U.S. economy is the sum of its parts, with each state contributing to the total output—making the COVID-19 decline even more evident when state-by-state change in GDP is taken into consideration.
| State | Real GDP Change | Biggest Industry Decline | Industry Change (p.p.) |
|---|---|---|---|
| Alabama | -29.6 | Durable Goods Manufacturing | -5.02 |
| Alaska | -33.8 | Transport and Warehousing | -9.43 |
| Arizona | -25.3 | Accommodation and Food Services | -4.2 |
| Arkansas | -27.9 | Health Care and Social Assistance | -4.57 |
| California | -31.5 | Accommodation and Food Services | -4.43 |
| Colorado | -28.1 | Accommodation and Food Services | -3.85 |
| Connecticut | -31.1 | Health Care and Social Assistance | -4.61 |
| Delaware | -21.9 | Health Care and Social Assistance | -4.19 |
| Florida | -30.1 | Accommodation and Food Services | -5.3 |
| Georgia | -27.7 | Accommodation and Food Services | -3.43 |
| 🇺🇸 U.S. | -31.4 | Accommodation and Food Services | -4.38 |
Note: Industry changes are reported in percentage points (p.p.) of total current dollar GDP between Q1 and Q2.
A total of 18 states took the biggest hit within the Accommodation & Food Services sector, which was also the industry that suffered the most nationally, dropping by 4.38%.
Highly dependent on tourism, Hawaii bore the brunt of decline in this industry with a 18.85% drop. According to The Economic Research Organization at the University of Hawaii (UHERO), a second wave of infections and expired financial assistance were behind this contraction.
Next, the Health Care & Social Assistance sector was most impacted in 17 states between the two quarters, falling the most in Tennessee (-6.25%).
The most resilient industry amid the pandemic was Financial Services. In the state of Delaware, home to major banks such as JPMorgan Chase and Capital One, the sector actually grew by 4.47%. However, Delaware’s GDP ultimately still fell due to contractions in other sectors.
Each Industry’s Worst Performing State
Looking at it another way, the worst-performing state by industry also becomes clear when the change in percentage points (p.p.) Q1’–Q2’2020 GDP contributions are measured. Of the 21 industries profiled, Nevada shows up in the lower end of the spectrum four times.
With many U.S. business leaders expecting a second contraction to occur in the economy, will future figures reflect further declines, or will states manage to bounce back?