
So it was distressing, this holiday season, to learn that the eastern goldfinch could soon depart the Garden State, at least for half the year. If global temperatures rise 3 degrees Celsius by 2080, the goldfinch’s summer range will no longer include any part of New Jersey, according to the National Audubon Society. So, too, will the goldfinch exit Iowa, where it is also the state bird. In fact, many state birds could soon fly their domiciles: the yellowhammer from Alabama, the purple finch from New Hampshire, the ruffled grouse from Pennsylvania. The official birds of Georgia, Idaho, and Utah will all see their ranges shrink dramatically in those states.
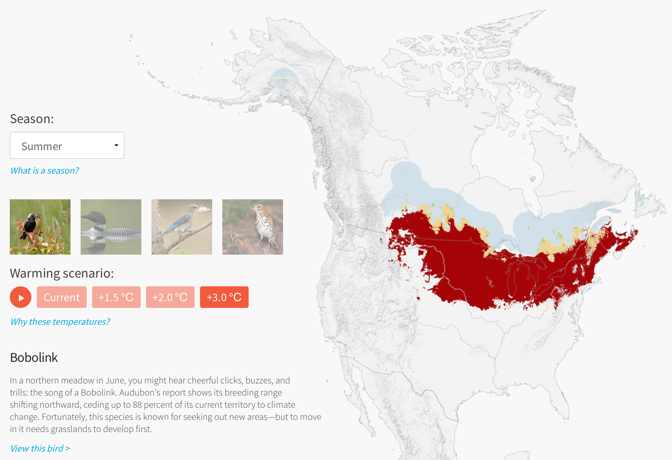
“Survival by Degrees” is a kind of field guide for the 21st century—the entire 21st century—containing maps of not only where birds live now, but where they’ll live several decades from now. It is also a novel scientific project in its own right. After analyzing how 604 North American bird species will fare, it argues that climate change will push more than two-thirds of the continent’s birds toward extinction in the decades to come.
Go and type in your zip code (if you’re in the United States) or home state or province (if you’re in Canada or Mexico), and the tool will spit out a list of every major local bird species. Each bird is linked to its listing into the Audubon field guide, with descriptions of its plumage, diet, mating habits, and contemporary range—as well as a projection of its range in 2080 under a very optimistic 1.5-degree-Celsius scenario, a 2-degree scenario, and a 3-degree scenario.
Like any good field guide, “Survival by Degrees” will teach everyone something slightly different. New Yorkers might see that piping plovers, a favorite shorebird, will vanish from much of the Atlantic Coast. The Baltimore oriole, meanwhile, will struggle to roost in some places near Camden Yards. And one of the country’s smallest songbirds, the golden-crowned kinglet, will be driven out of nearly its entire range in Oregon.
This kind of localization is possible because the underlying sources of data are immense. Audubon’s scientific team pulled together 140 million bird sightings across more than 70 different data sources, including the U.S. Geological Survey and Parks Canada. Some of the data came from Ebird, an online repository run by Cornell University that tracks bird sightings recorded by nonscientists. The team matched each of those observations with environmental data about the local climate: in effect, fitting a bird to its climatic range today. Then it used global climate models to project how those ranges could shift in the future. For example, “a lot of these areas in Wisconsin will look more like Kansas,” Brooke Bateman, the senior climate scientist at the Audubon Society, told me.
Stamen Design previously collaborated with Audubon on a 2014 visualization of climate data. (This article is the first time they’ve discussed their collaboration with the press.) But this version has much higher spatial resolution and is much more localized than the previous iteration. “If you can take what feels like a giant, abstract, kind of immovable problem like climate change and break it down into something you can actually see, then you’re one step closer to motivating a person,” John Mahoney, the vice president of products at the Audubon Society, told me. “Localizing the data was the No. 1 priority.”
There’s a simple reason birds are a great entry into understanding climate change, Eric Rodenbeck, Stamen’s founder and chief executive, says: “Birds are beautiful.” But they also reveal the geographic specificity of climate impacts. “My whole fascination is with traces left in the world by other parts of the world,” he told me. “A bird is like a vector you can trace.” They are, like climate change itself, physical instruction in the fact that we live on a planet. After all, the migratory birds chirping in your yard right now may have seen more of the Earth than you have. And so climate change, a malady of the entire planet, will harm birds as well.
Climate change is notoriously hard to communicate, since it will alter the Earth in a million different ways all at once. “Survival by Degrees” does an unusually good job of revealing how one category of those changes will look in every place in North America. There’s nothing else like it online.
We want to hear what you think about this article. Submit a letter to the editor or write to [email protected].